Viewing Statistics
Track revenue, completed work, and business trends by week, month, or year.
Overview
The Statistics page turns your completed Orders and payments into numbers and charts so you can spot trends in revenue and workload. Data is tracked automatically — there's nothing to set up.
Click Statistics in the sidebar to open it.
Before you start
- Statistics only appear after you've completed Orders and received payments. Until then the page shows an empty state.
- In team mode, statistics cover the whole team account.
Choosing a Time Period
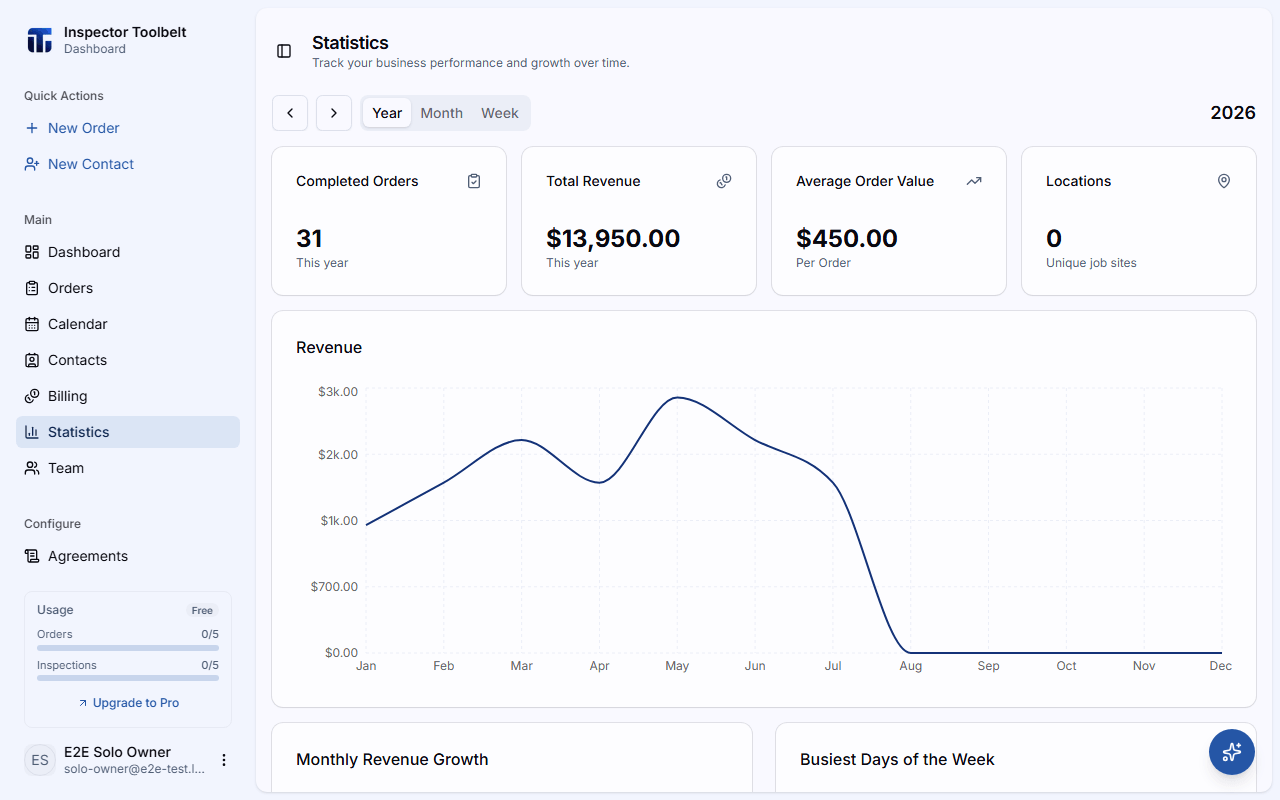
Pick a period with the Year, Month, or Week tabs in the toolbar. Switching tabs jumps back to today.
Use the left and right arrow buttons to step back or forward in time — one year, one month, or one week per click.
Check the heading on the right of the toolbar — it shows the exact period you're viewing (for example a year, a month name, or a 7-day date range).
The periods work like this:
| Tab | What it covers |
|---|---|
| Year | The full calendar year (January 1 – December 31) |
| Month | The last 4 weeks ending on the selected date |
| Week | The last 7 days ending on the selected date |
Key Metrics
The cards at the top summarize the selected period:
| Metric | Meaning |
|---|---|
| Completed Orders | How many Orders were completed in the period |
| Total Revenue | Money collected in the period |
| Average Order Value | Total revenue divided by completed Orders |
| Locations | Unique job sites served |
Locations count the whole year
The Locations card always counts unique job sites for the selected year, even when you're on the Week or Month tab.
Charts
- Revenue — revenue over time. Year view shows monthly totals, Month view shows weekly totals, and Week view shows daily totals.
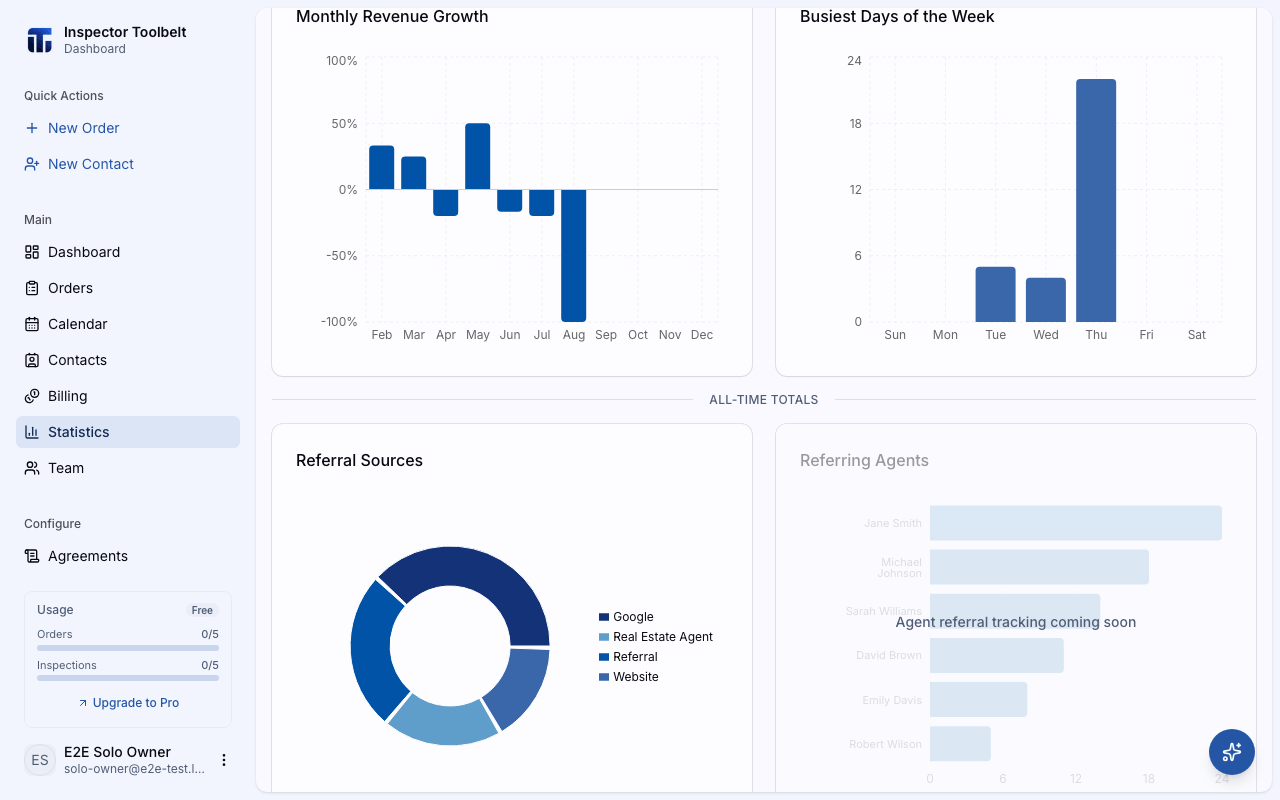
- Monthly Revenue Growth — how much revenue grew or shrank compared to the month before, as a percentage. Only shown in Year view.
- Busiest Days of the Week — which weekdays carry the most completed work in the period.
Below the All-time totals divider, these charts show totals for the whole year and don't change with the Week/Month/Year tabs:
- Referral Sources — where your business comes from, based on the referral source recorded on each Order.
- Team Orders and Team Revenue — how completed work and revenue split across your team members. These two charts only appear when team members have completed Orders recorded to them.
What you should see
Every card and chart updates when you change the tab or step through time. Money values use your account's currency, and the team charts show each member by name.
If something goes wrong
- "No statistics available" — you haven't completed any Orders or received payments yet, or you've stepped to a year with no activity. Use the arrows to return to the current year.
- A chart says "No data yet" — there's no data for that chart in the selected period. Growth trends, for example, need revenue in at least two months.
- Team charts are missing — they only appear once team members have completed Orders recorded to them.